How to Use Page-Level Analytics to Improve Your Digital Publication in 2026
Learn how to use page-level analytics to understand reader behaviour, spot drop-off points, and make smarter content decisions that improve every digital publication you produce.
Written By: Jagadish C U (Founder Of Zentrovia Solutions)
What Page-Level Analytics Can Tell You About Your Readers
Publishing a digital document without tracking how readers interact with it leaves you guessing. You know people received it. You know it was opened. But you have no way of knowing whether they read it, skipped it, or stopped two pages in.
Page-level analytics closes that gap. Instead of relying on surface-level metrics, you can see exactly which pages hold attention, where readers drop off, and how long each section is actually being read. That data becomes the foundation for producing better publications every single time.
To truly maximize your digital publication engagement, modern publishers are moving beyond basic metrics and relying entirely on page-level analytics. By tracking exactly how readers engage with your interactive flipbooks, you gain actionable insights into which pages hold attention and which cause drop-offs. This precise data allows you to continuously refine your content, ensuring your digital documents maintain high engagement while effortlessly supporting essential document accessibility standards.
This blog covers how page-level analytics works, what to track, and how Zenflip gives publishers the tools to turn reader engagement data into real editorial improvements.
What Is Page-Level Analytics?
Page-level analytics is the tracking of reader behaviour on a per-page basis within a digital publication. Rather than telling you only how many times a document was opened, page-level analytics shows you what happens inside it - which pages were viewed, how long each page held attention, and where readers stopped engaging.
This level of detail transforms a static publication into a measurable asset. It shifts the question from "did people read it?" to "how did people read it?" - and that distinction is what makes page-level analytics one of the most powerful publication performance metrics available to content teams today. Watch: How to Convert PDFs to Interactive Flipbooks | A Simple And Quick Guide
Why Publication Performance Metrics Matter More in 2026
In 2026, reader attention is the most competed-for resource in content. Audiences are selective, and digital content is measured not just by reach but by depth of engagement. Publication performance metrics have evolved accordingly - away from download counts and toward engagement-focused data that reflects how deeply a document was actually consumed.
Teams that rely only on open rates or click-throughs are missing what happens after the document loads. Page-level data fills that gap, giving publishers a clear and honest picture of content performance at every stage of the reader journey.
For publishers using interactive document tracking, this is no longer a nice-to-have. It is a core part of any serious content analytics strategy. Read: Flipbooks in Content Marketing 2026 - Interactive Strategy Guide
Key Metrics to Track in Every Publication
Read Time Analytics
Read time analytics shows how long a reader spent on each individual page. A page with consistently short read times is either being skipped or scanned - which is useful information regardless of how strong you think the content is.
When tracked across multiple editions, read time analytics helps you identify whether long-form content is actually being read, which visual pages hold attention, and where the pacing of your publication may need adjustment.
Drop-Off Pages
Drop-off data shows the exact pages where readers exit the publication. If a consistent portion of your audience stops reading at the same point across different issues, that page is telling you something. The content, layout, or structure at that point is creating friction.
Identifying drop-off pages early is one of the most direct ways to optimize digital publications before the next edition is produced.
Section-Level Engagement
Beyond individual pages, understanding which sections of your publication hold attention the longest helps you make better structural decisions. High-engagement sections reveal what your audience values. Low-engagement sections signal what to reconsider - whether that means cutting, reorganising, or reformatting.
Read: Flipbook Analytics: The Metrics That Actually Matter
How Zenflip Supports Page-Level Analytics
Zenflip is built with page-level analytics as a native feature. As a dedicated document tracking software, Zenflip tracks read time, page views, and reader engagement data automatically - without requiring third-party integrations or separate analytics tools.
Every publication hosted on Zenflip generates data on how readers move through each page. Publishers can review which pages performed well, identify where readers dropped off, and use that information to make informed decisions before the next issue goes out.
This positions Zenflip not only as a publishing platform but as a content analytics strategy tool - one that turns each edition into a data source for the next. Watch: How to Publish Your First Flipbook on ZenFlip | PDF to Flipbook Tutorial
A Simple Framework for Acting on the Data
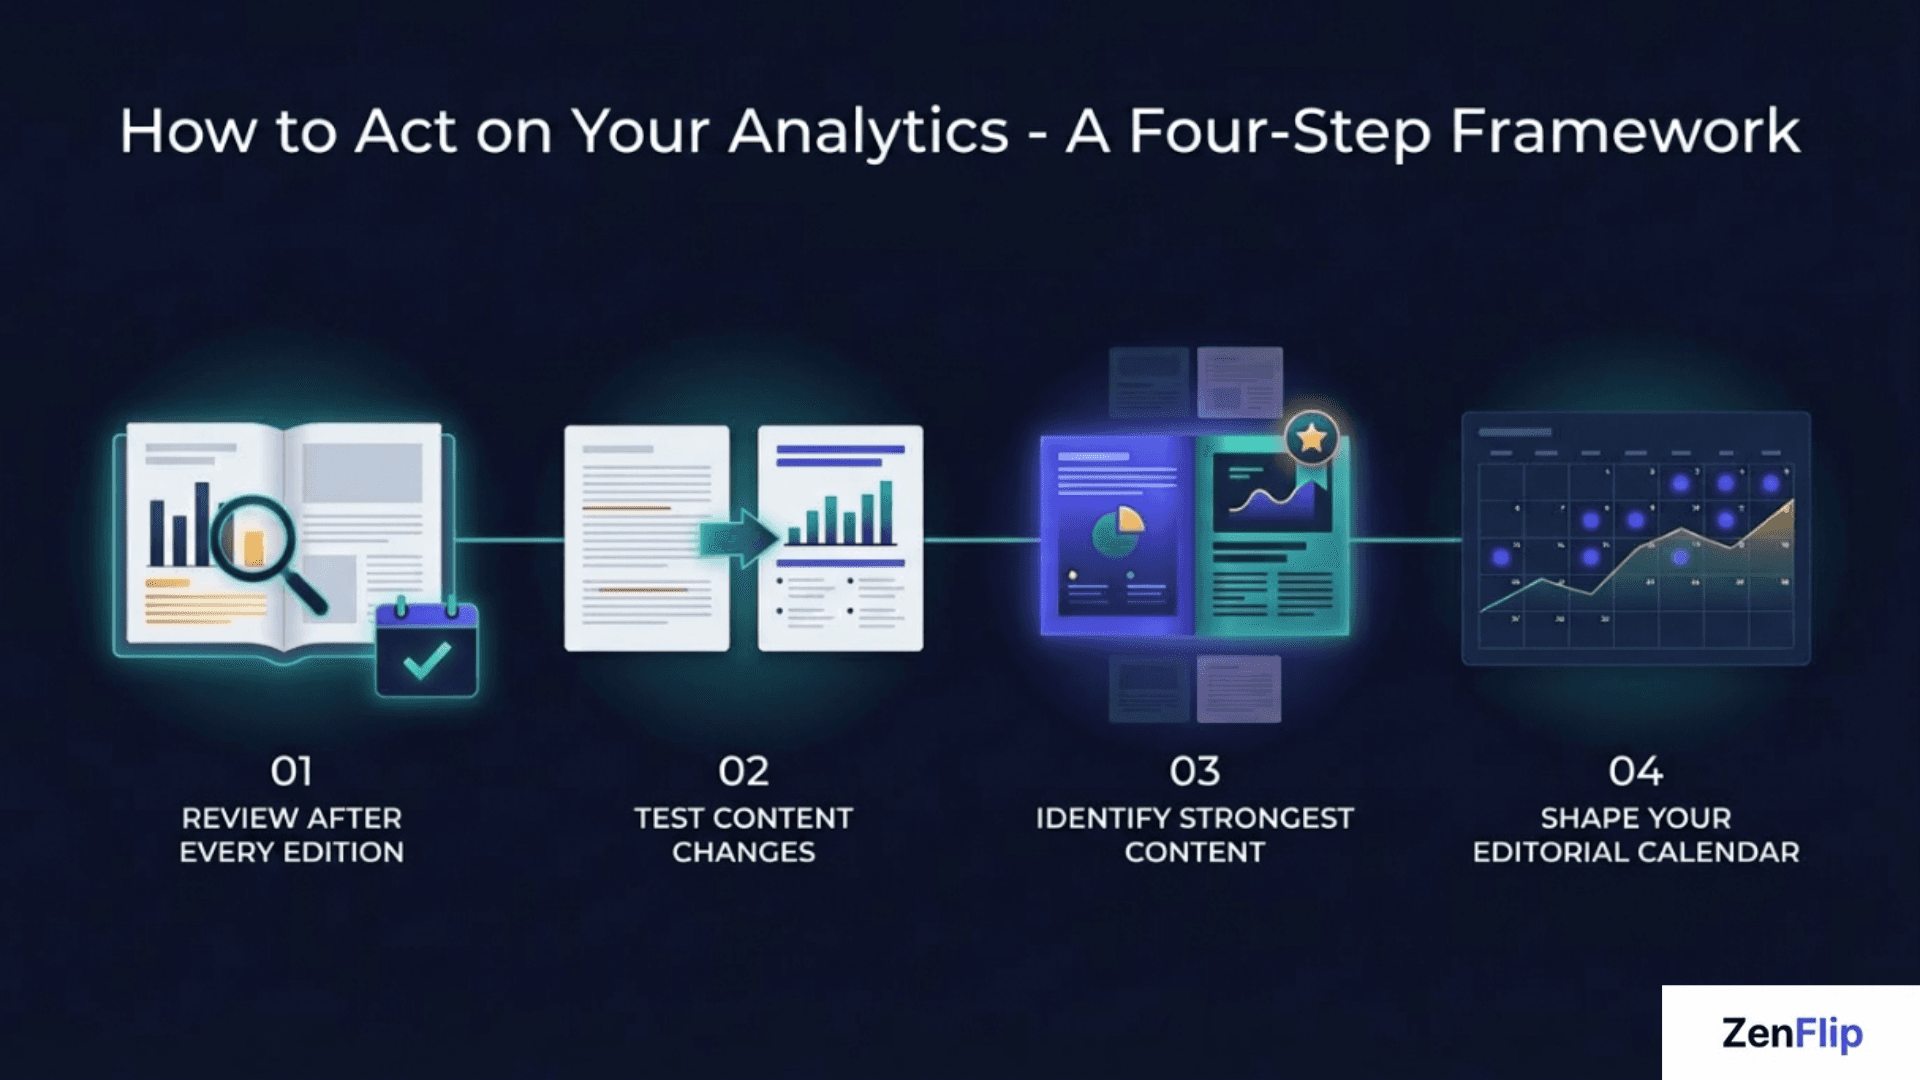
Analytics only create value when they lead to action. Here is a straightforward approach to turning page-level data into publication improvements.
Review after every edition. After each publication, check which pages recorded low read time and which pages had the highest drop-off rates. Look for patterns rather than isolated results.
Test content changes. If a page consistently underperforms, change one variable at a time - the format, the headline, the visual layout. Track whether the change improves performance in the next edition.
Identify your strongest content. High-engagement pages are a template. If a particular format or content type consistently holds attention, apply it more broadly across the publication.
Let the data shape your editorial calendar. Reader engagement data is one of the most honest editorial inputs available. Topics and formats that perform well should inform what you produce next.
Building a Content Analytics Strategy Around Your Publications
A single analytics review after one edition is useful. A consistent content analytics strategy built into your publishing cycle is transformative.
The goal is a feedback loop - publish, measure, learn, improve. With Zenflip's interactive document tracking built in, every publication you release gives you richer data than the one before. Over time, this shifts editorial decisions from instinct-based to evidence-based, and the quality of your publications reflects it.
Whether you are publishing a newsletter, a company report, a product catalogue, or a magazine, page-level analytics gives you the kind of reader engagement data that makes each edition measurably better than the last. Visit: Zenflip.io
Explore More on ZenFlip

Looking for more insights on digital publishing, accessibility, sports, technology and more? The ZenFlip Library has you covered. Browse our full collection of free interactive magazines.
Every topic. One place. Read free at ZenFlip | Library
Frequently Asked Questions
What is page-level analytics?
Page-level analytics is the tracking of reader behaviour on a per-page basis within a digital publication. It shows which pages were viewed, how long each page held attention, and where readers stopped engaging - giving publishers a detailed picture of how their content is actually consumed.
How is page-level analytics different from basic document metrics?
Basic document metrics typically tell you how many times a file was opened or downloaded. Page-level analytics goes deeper, showing what happens inside the document - which pages held attention, where readers dropped off, and how long each section was read.
What is read time analytics?
Read time analytics tracks how long a reader spent on each individual page of a publication. It helps publishers understand which pages are being read thoroughly and which are being skipped or scanned.
What are drop-off pages?
Drop-off pages are the specific pages within a publication where readers exit. Consistent drop-off patterns across editions indicate that the content, layout, or structure at that point needs attention.
How does Zenflip support page-level analytics?
Zenflip includes page-level analytics as a native feature. It automatically tracks read time, page views, and reader engagement data for every publication, without requiring third-party tools or integrations.
What is interactive document tracking?
Interactive document tracking refers to the real-time monitoring of how readers engage with a digital publication - including which pages they view, how long they stay, and where they leave. Zenflip provides this as a built-in capability.
Why should content teams use a content analytics strategy?
A content analytics strategy turns individual data points into a consistent improvement cycle. By reviewing publication performance metrics after every edition, teams can make evidence-based decisions about what to produce, how to structure it, and where to focus editorial effort.
#PageLevelAnalytics #FlipbookAnalytics #DigitalPublishing #ContentAnalytics #ReaderEngagement #PublicationMetrics #InteractiveContent #ContentMarketing #DocumentTracking #ZenFlip
Turn your next PDF into a flipbook — free
No credit card, no watermarks, no time limits. 5 publications on the free plan — ready in under 2 minutes.